I got some questions from customers that didn’t know how to enable Microsoft Fabric and that they only see Power BI Items and not the new announced Experiences. In this short blog I will explain how you can easily enable Microsoft Fabric.
How to enable Fabric
If you want to try Fabric in your tenant, you need to enable the Fabric features in your Power BI admin portal.
To do, go to https://app.powerbi.com/.
Note: You must be an Power BI administrator
Please note that Microsoft FabricCapacity(Trial)or Power BI Premium Capacity is required to get started with Microsoft Fabric.
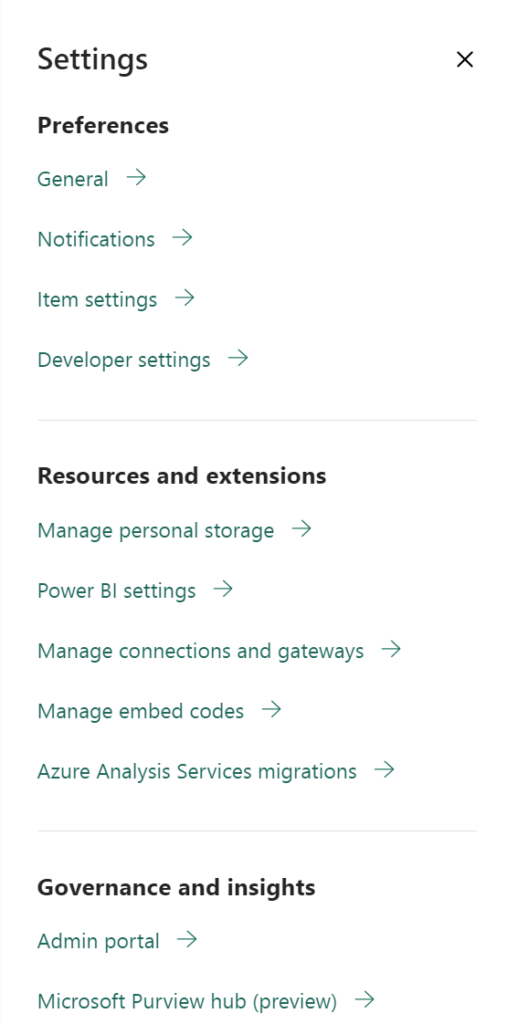
Open the Microsoft Fabric admin portal.
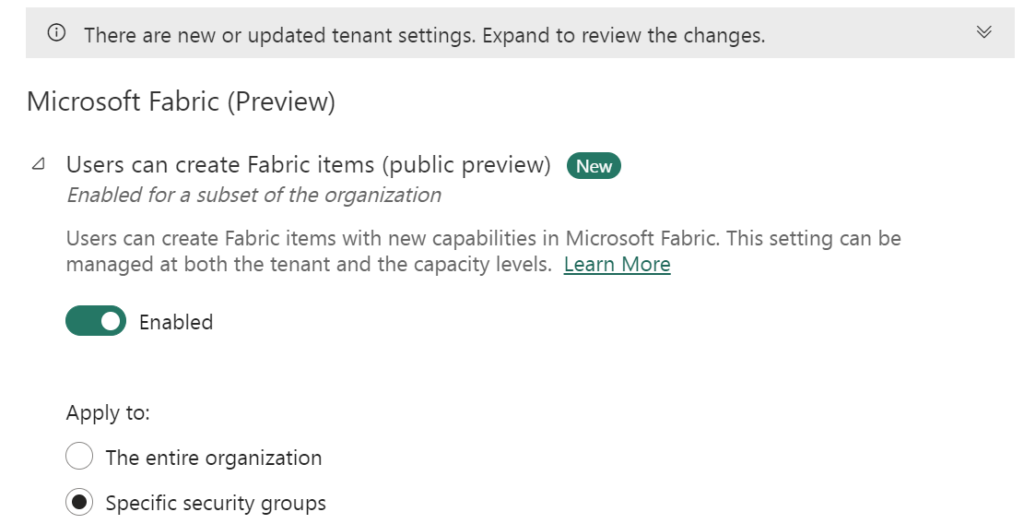
By default, Microsoft Fabric is disabled (if you do not change the setting, it will be set to ON after July 1st 2023).
You enable Microsoft Fabric for the whole organization or you can just start with a small group(Specify Security Groups). My advice is to start with a small group. Microsoft Fabric is in Public Preview and not ready for Production Environments.
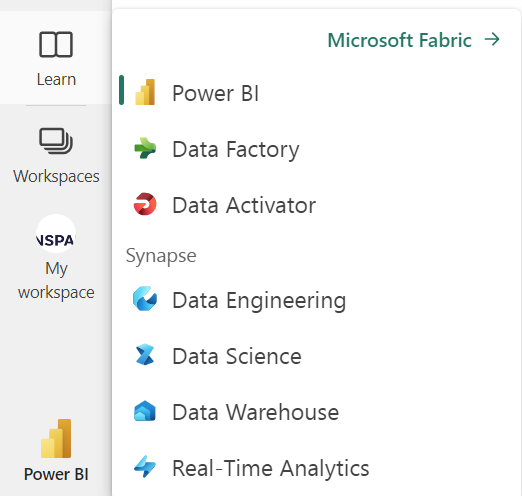
It will take up to 15 minutes to deploy these setting, mostly much faster. After that the new experiences will be available.
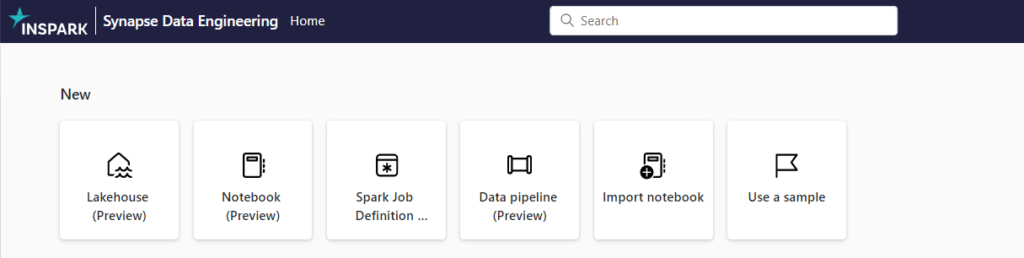
Select Data Engineering
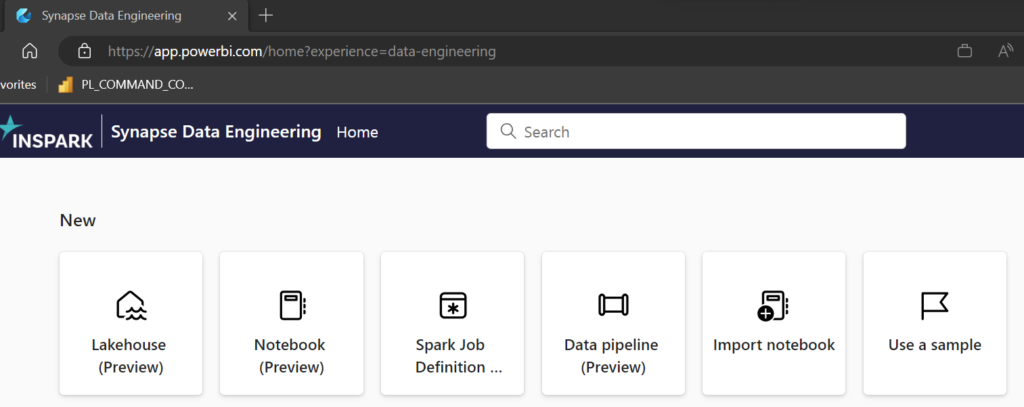
In the top of the page you can directly, see which experience you use.
In this case Synapse Data Engineering Experience, check out the logo on the left side and the text behind home?experience
Start Trial
Have a look to this page how easily it is to get started with a free TrialFabric (preview)
Guy in the Cube
You also watch the video, who Adam Saxton created:
Documentation
If you have any questions, I’d love to hear them. More information about Microsoft Fabric can be found at my Content Hub:
Since the first of June 2023, we can create Fabric capacities in Azure. This are currently the Pay as You go pricing, later this year the Azure Reservation will follow. OneLake storage pricing is comparable to Azure ADLS (Azure Data Lake Storage) pricing and is not included in the price below. These prices are prices in the West-Europe region, prices can be different across regions.
Note: As you can see, the F1024 and F2028 are not having the correct prices, it should be 2 or 4 x F512. The error is already is report to the Fabric Team.
Microsoft Fabric Capacity is a distinct pool of resources allocated to Microsoft Fabric that resides on a tenant. The size of the capacity determines the amount of computation power your organization gets.
Microsoft Fabric has an array of capacities that you can buy. The capacities are split into SKU's. Each SKU provides a different amount of computing power, measured by its Capacity Unit (CU) value.
Creating Fabric Capacity in Azure
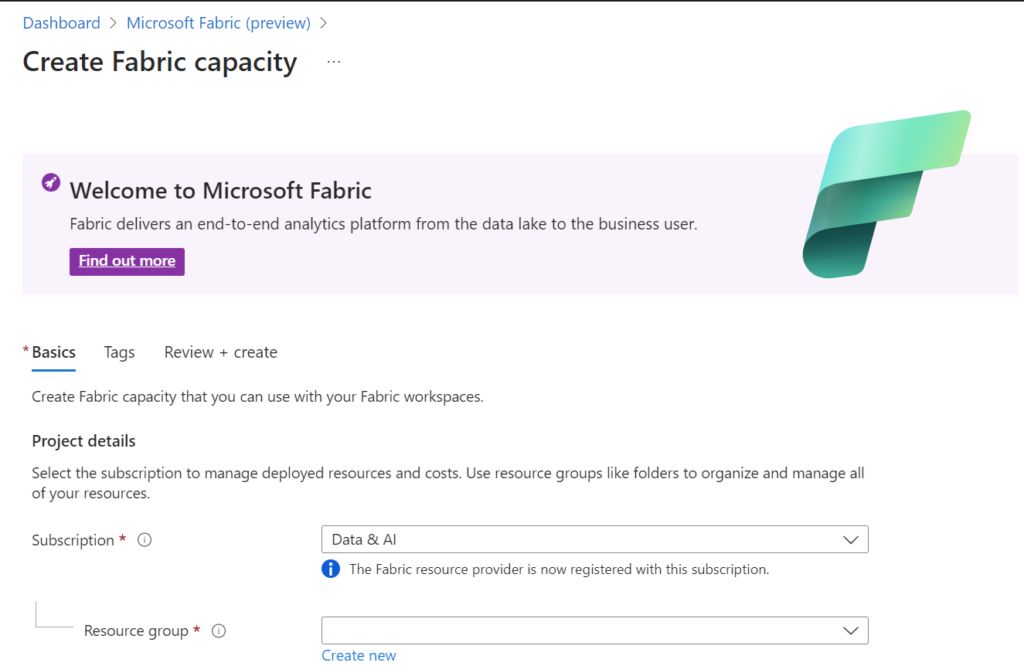
Search for the Fabric Capacity in the Azure Marketplace.
Select the appropriate Subscription and resource group. You can move the Fabric capacity to another Resource Group later if needed.
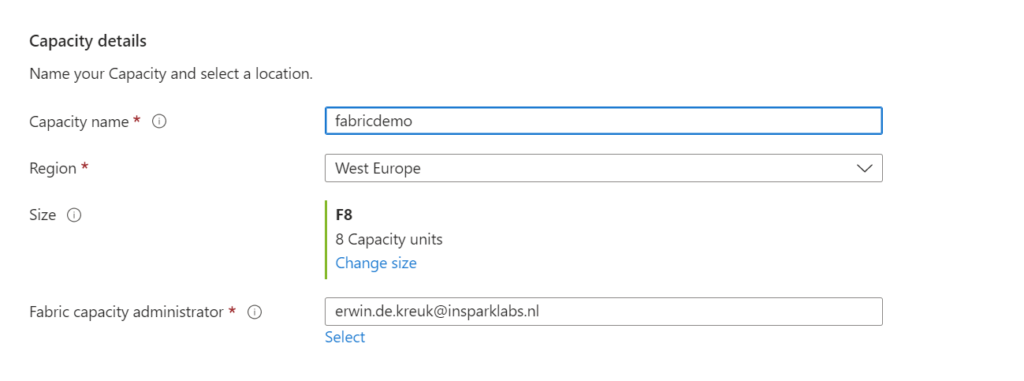
Provide a name for the capacity.
Define the region for the capacity.
Choose the desired size, starting from F2. F64 is equivalent to a Power BI Premium capacity. You can learn more on this page.
Assign a Fabric capacity Administrator.
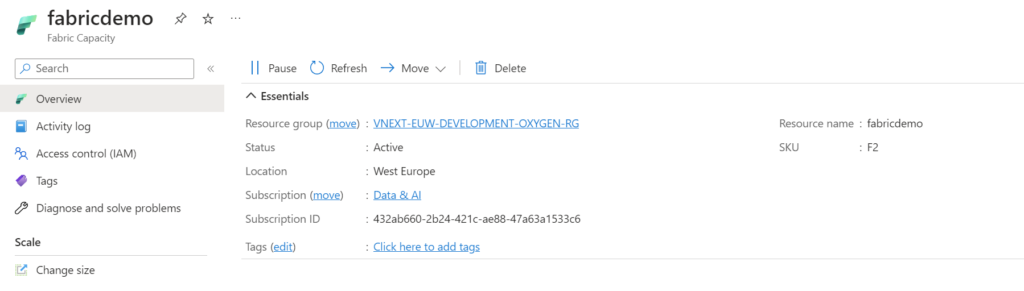
Click on "Create" to initiate the capacity creation process. Once created, you will see the relevant information on the screen.
Assign capacity in Microsoft Fabric
After creating the Fabric capacity, you need to assign it to a Workspace by following these steps:
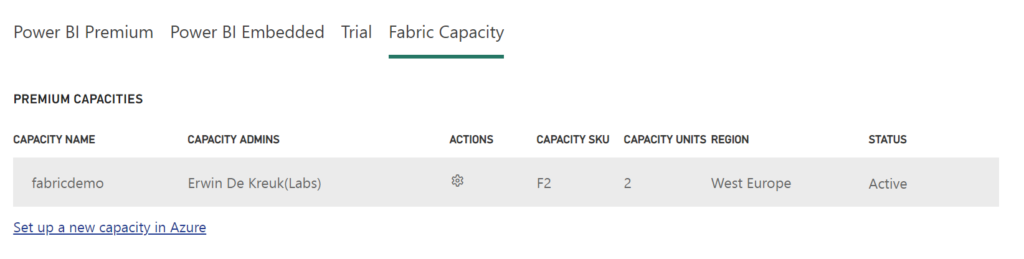
Open the Microsoft Fabric admin portal.
Select the capacity option on the right side.
Locate the recently created capacity in the list.
Assign capacity to a Workspace
The last step is to assign the capacity to a Workspace.
On the Workspace level, click on settings.
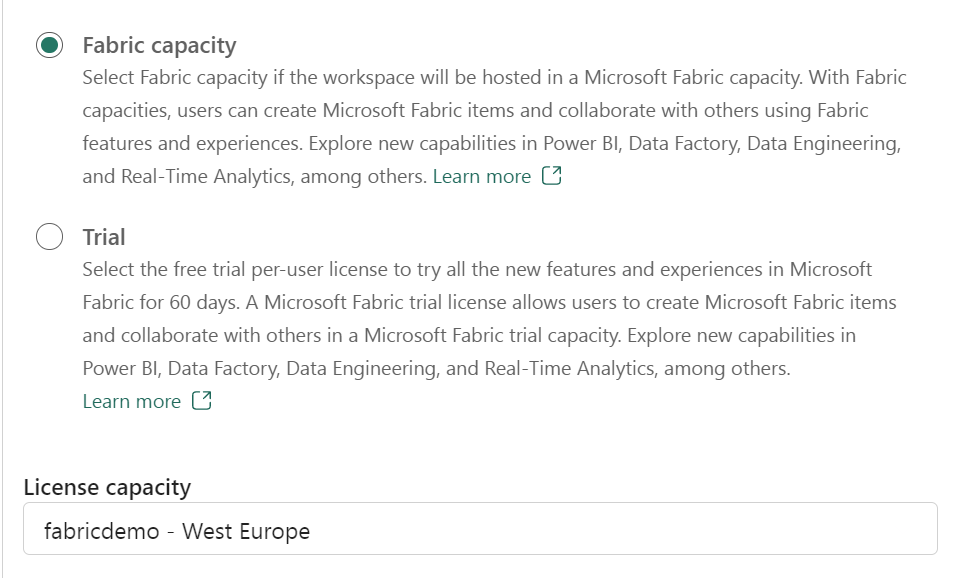
Go to the Premium tab and select the Fabric capacity.
Define the correct License capacity for the Fabric capacity.
Select the Fabric Capacity and define the correct License capacity to it. That's all, you are now using the new capacity.
Capacity Pause/Resume
With the Fabric capacity set up, you can take advantage of the Pause/Resume feature, which allows you to temporarily halt and resume the capacity, making it useful for development and testing purposes. However, please note that this option will not work if you purchase Azure Reservation in the future.
Microsoft Fabric app
To monitor usage and related to Microsoft Fabric capacities, you can use the Microsoft Fabric utilization and metrics app.
To install the Microsoft Fabric Capacity Metrics app for the first time, follow these steps:
When prompted, sign in to AppSource using your Microsoft account and complete the registration screen. The app takes you to Microsoft Fabric to complete the process. Select Install to continue.
In the Install this Power BI app window, select Install.
Wait a few seconds for the app to install.
It's a pretty simple process to set it up.
Documentation
If you have any questions, I'd love to hear them. More information about Microsoft Fabric can be found at:
Connecting Azure Event Hubs with Eventstream in Microsoft Fabric
In my previous blog I did give you an introduction of the possibilities of Real-Time Analytics in Microsoft Fabric.
In this blog we will have a closer look into how we can connect data from one of our existing Azure Event Hubs.
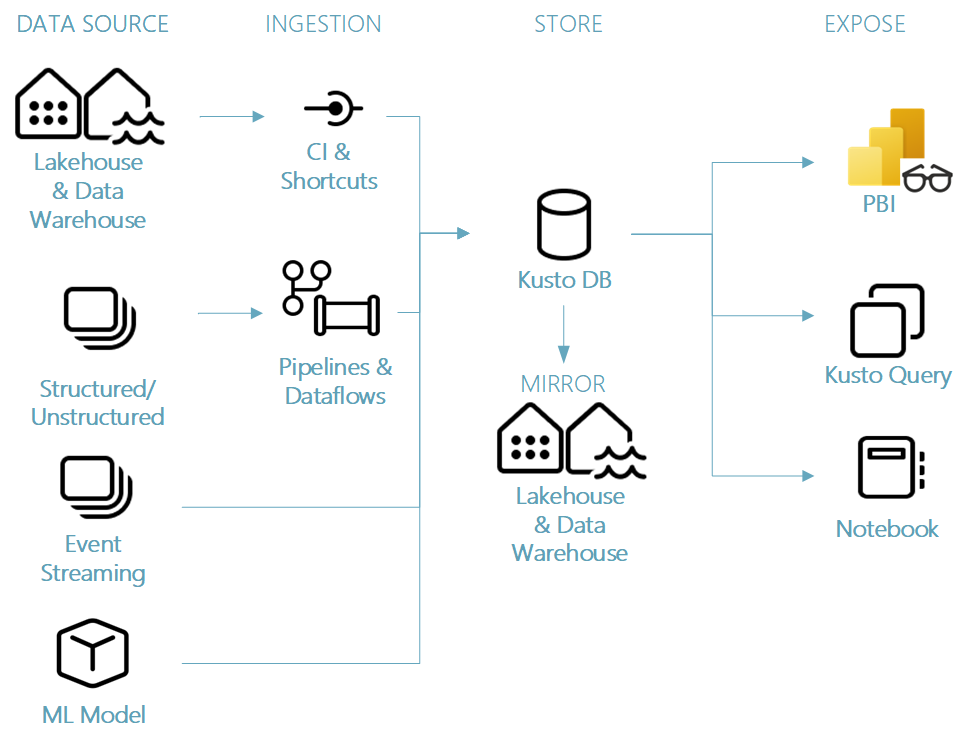
Looking to the above picture, you see an end to end workflow for a Real-Time Analytics scenario. We can directly see which Fabric Artifact we need to use to build the solution. To build the complete solution below took me maximum 20 minutes,.
Loading data from Azure Event Hubs to Lakehouse
Requirements:
An existing Azure Event Hub.
New consumer group(never you use an existing). If you use an existing consumer group then it can happen that the event hub stop sending messages to your existing environment.
Fabric Workspace
Note:
Adding a consumer group is not available in the Basic tier but only in the Standaard Tier.
Creating a Shared Access Policy on the Event Hub
Create a new Shared Access Policy on the Event Hub, with the manage option enabled.
Note down the SAS Policy name and the Primary Key. We will need this later to setup the Connection in Microsoft Fabric.
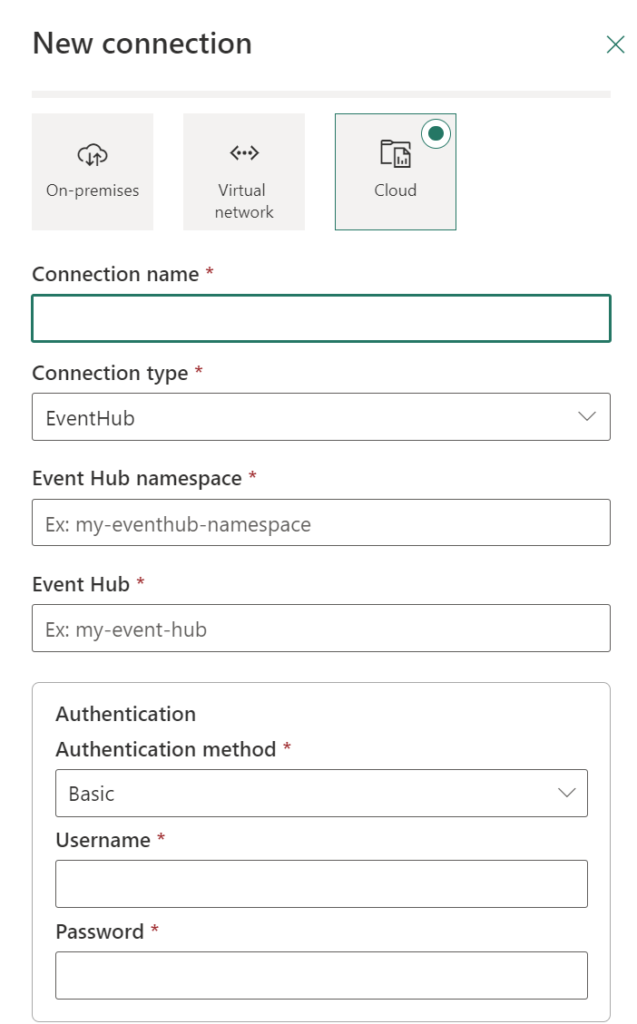
Create a Data Connection in Microsoft Fabric
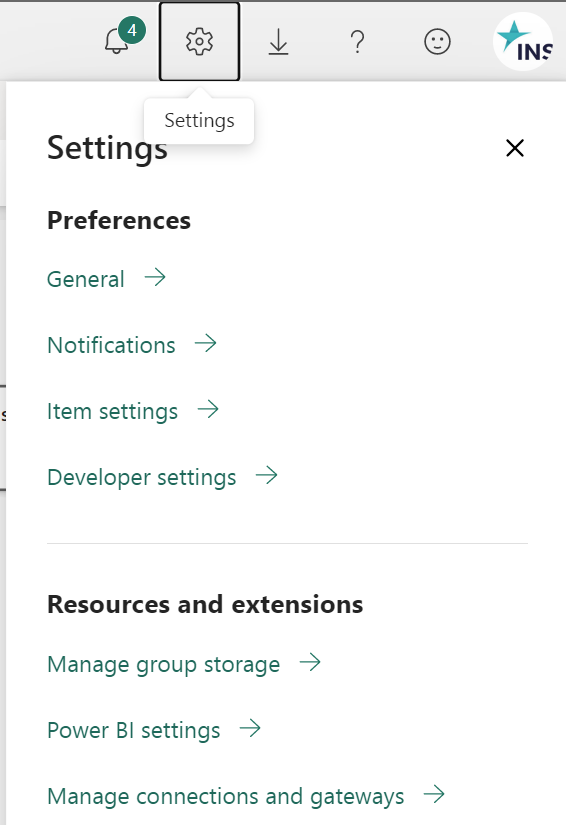
In the menu bar(top right) open the settings toggle and open the Manage Connection option.
Make sure you have a Microsoft Fabric or Power BI Premium capacity assigned to this workspace.
Create Eventstream in Microoft Fabric
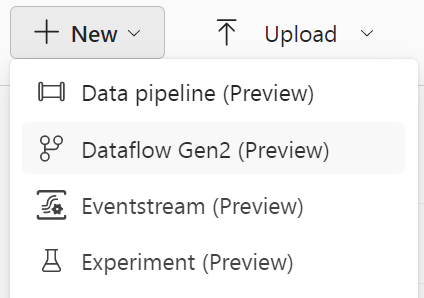
Within our Fabric Workspace, select NEW on the left upper corner and select Eventstream.
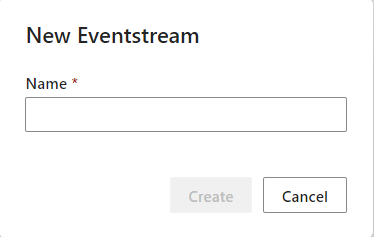
Define a name for the Evenstream and click on create.
This can take a couple of minutes to setup, but don’t worry there are a lot of things happening in the background. Microsoft Fabric is a SaaS application so things needs to be deployed for you.
The great advantage for you, things will much easier to setup.
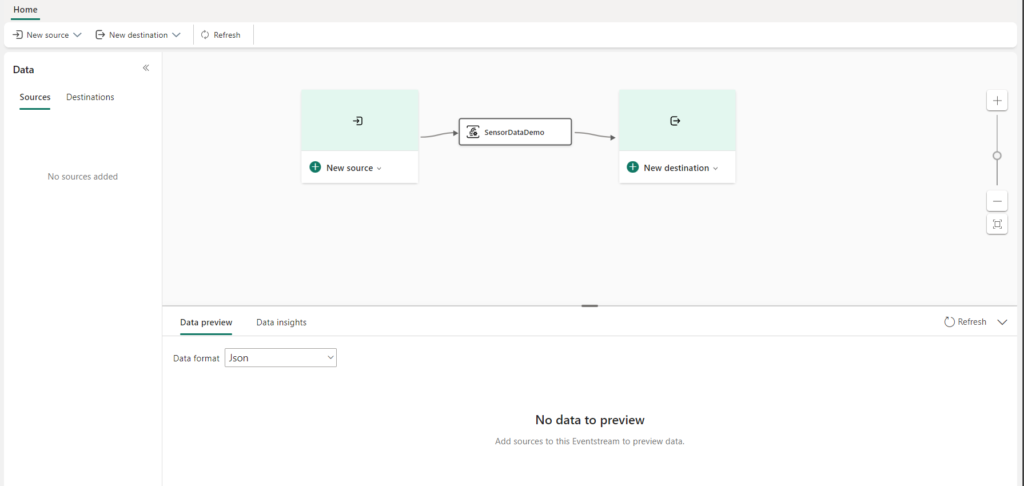
So once everything is ready you will see this new screen:
Create the Eventstream Source
Next step is to connect our Source, in this case the connection to the Event Hub.
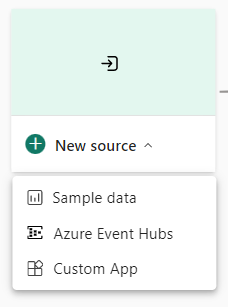
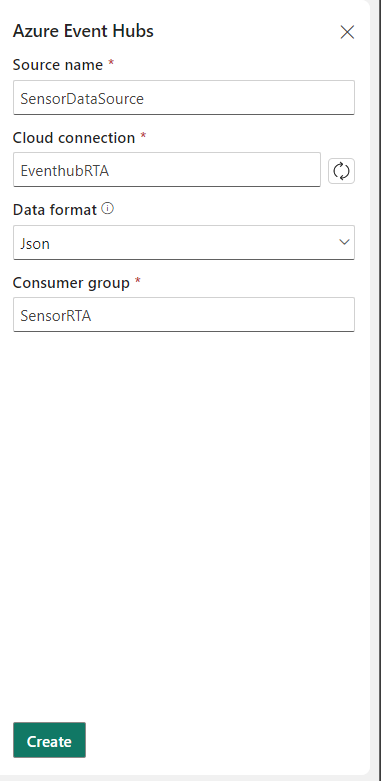
Select the Azure Event Hubs, a new pane will open.
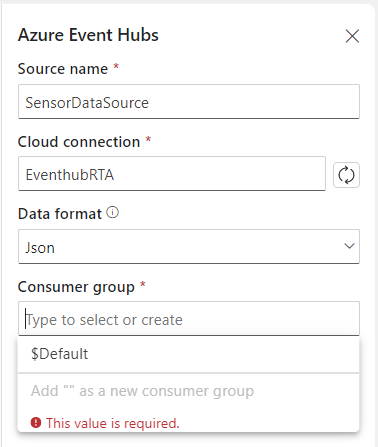
Source name
Define a name for your source, you can use the name of the Event Hub or a custom name
Cloud Connection
Select the connection you’ve created in the beginning of this blog
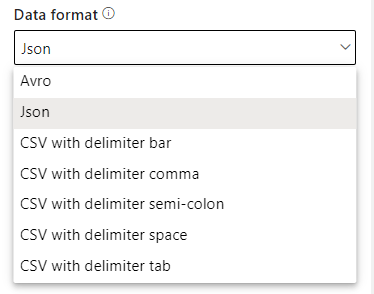
Data Format
Define the correct format based on your Event Stream
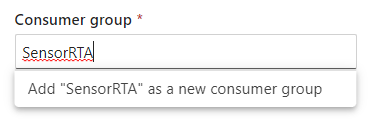
Consumper group
You can select a group you have a created in the beginning of this blog. Or you create a new one as well.
Note: Never you use an existing Consumer Group, because your current application connected to this Consumer Group will stop receiving data.
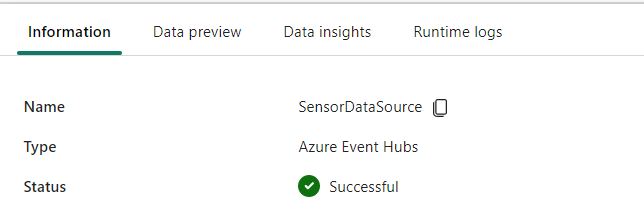
Once all the required field are filled in, click on Create. Now the source of your Eventstream will be created.
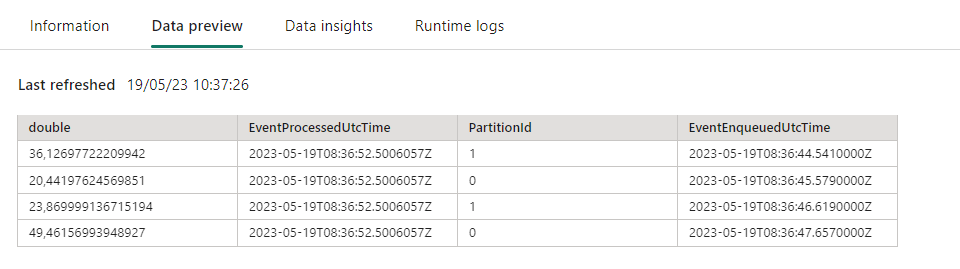
After the connection is setup successfully you can click on Data Preview, to see what kind of data is coming in and if this is the correct data.
If you data is not shown the correct way, you can change data format to csv or avro.
Destination
One of our last steps in our configuration is to setup the destination for the Eventstream.
In this blog we will use a Lakehouse(more destination are available), so that we can store our data and use it in a later stadium to build reports on top of the data.
Lakehouse
You can choose if you want to create a new Lakehouse or use an existing one.
If you do not have created a Lakehouse, you need to create one.
Select in left bottom corner, the option Data Engineering.
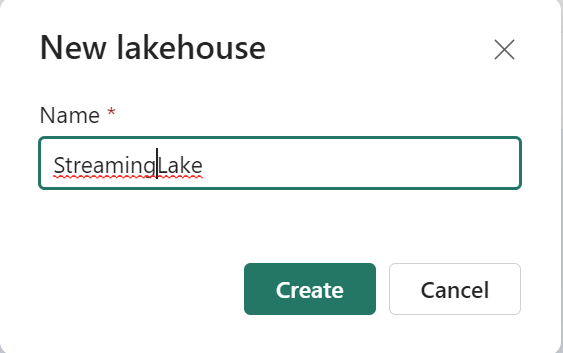
Create a New Lakehouse, define a name and click on create.
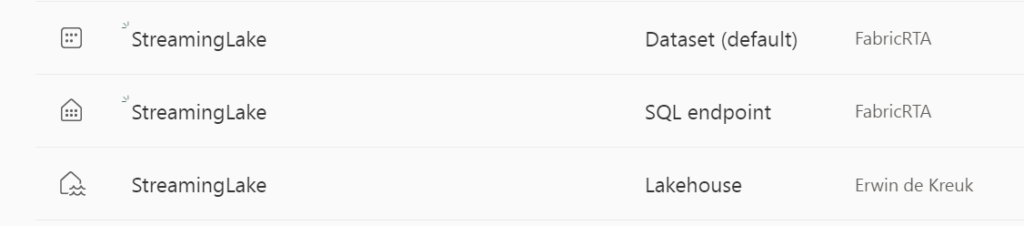
After creating a Lakehouse, you will see that Automatically a Dataset and a SQL Endpoint are created by default. How easy is that!
Create the Eventstream Destination
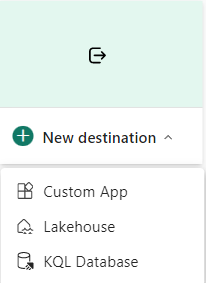
Create Lakehouse as Eventstream Destination
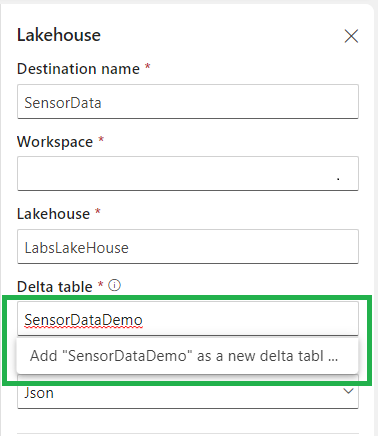
A new windows will open were we can configure the Lakehouse connection/destination.
Destination Name
The name of the destination
Workspace
The workspace were you’re Lakehouse is located
Lakehouse
The Lakehouse you want to use(you can have more than 1 in the same workspace)
Delta table
The Delta Table were you want to store the data, you can also create a new table from here.
Data format
Mostly the same format as the data you added to in Source
Event Processing
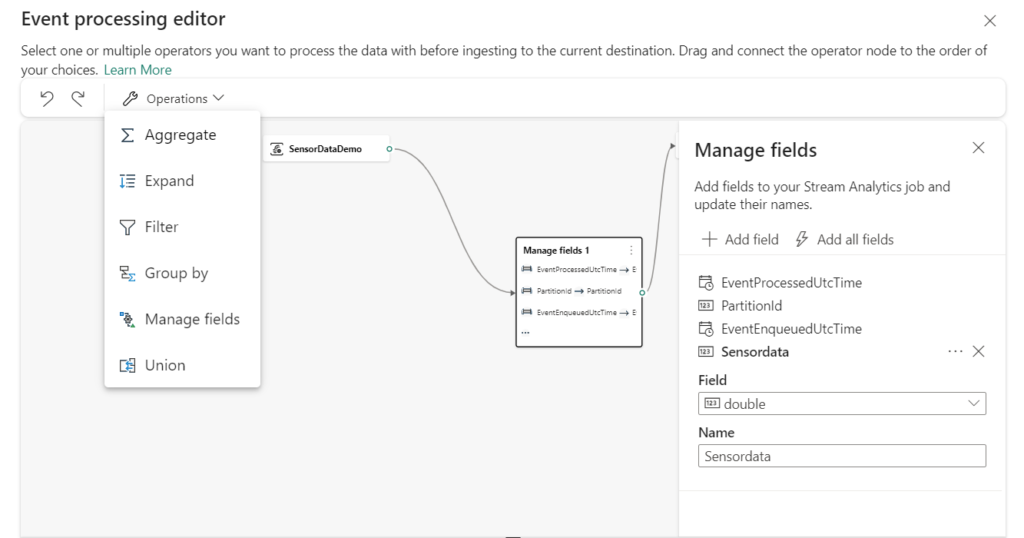
Before you create the destination, you can transform and preview the data that is being ingested for the destination with the Event Processor. The event processor editor is a no-code experience that provides you with the drag and drop experience to design the event data processing logic.
As you can see there’re a lot of operations/transformation possible to transform your data in a correct way, renaming a field is a matter of seconds with a no-code experience.
The last step is to create the destination. It is just as easy as it is, click on Create.
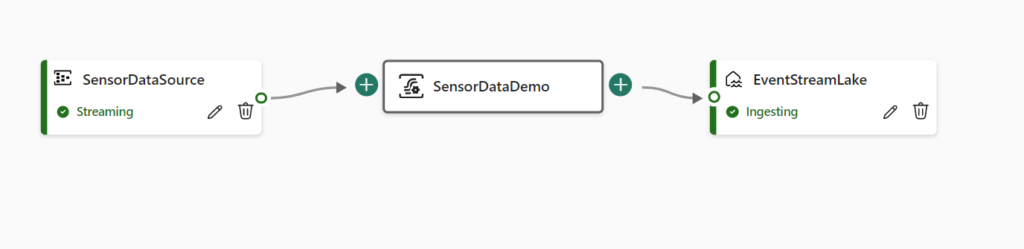
The Eventstream is ready, Source is streaming data and the destination is Ingesting data.
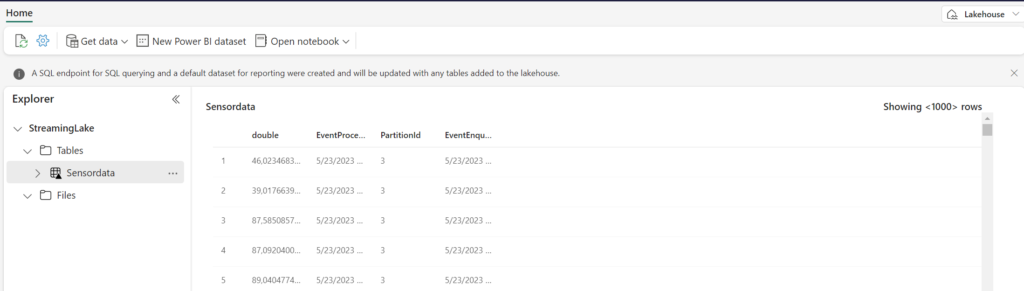
Navigate to your Lakehouse to verify the ingested data.
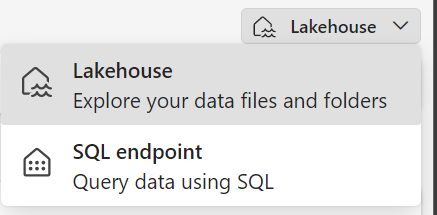
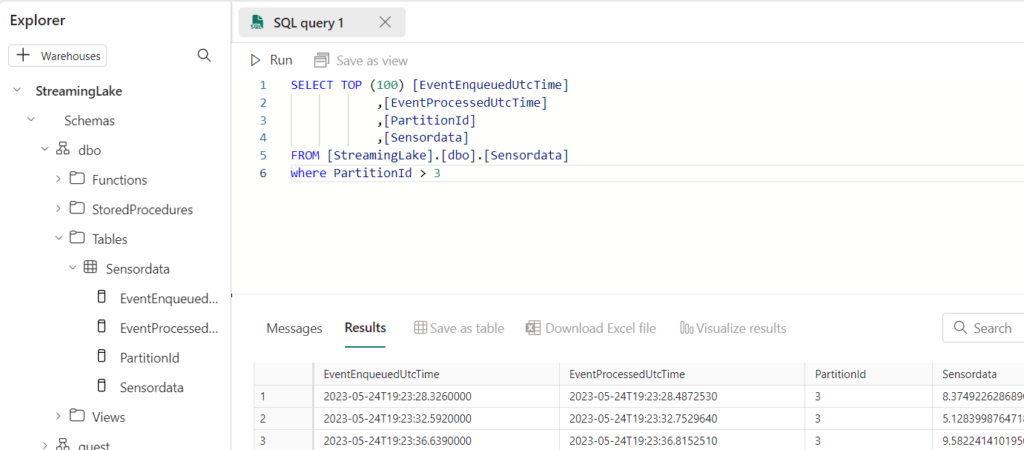
If you prefer to verify with a TSQL command, you can easily switch to a SQL Endpoint mode, which is located in the upper right corner.
And now you can run any type of query you want.
Next Steps
Build Power BI report with the ingested eventdata in the Lakehouse. As mentioned before a default dataset is already created.
In my next blog I will explain how we can start using the KQL database as a destination, so stay tuned.
Documentation
Click below to read more about Microsoft Fabric and Real-Time Analytics.
Introduction to Real-Time Analytics in Microsoft Fabric
Real-Time Analytics is one of the data and analytical workloads/experiences available in Microsoft Fabric, the new platform currently in Public Preview at Microsoft. With Real-Time Analytics, companies and developers can gain valuable insights and analysis from real-time data streams.
A unified analytics solution for the era of AI
Microsoft Fabric brings a unified SaaS-based solution that stores all organizational data where analytics workloads operate. Microsoft Fabric brings together existing offerings such as Data Factory, Azure Synapse Analytics, and Power BI into one unified product for all data and analytics workloads.
Key pilars:
Complete analytics platform
Lake centric and open
Empower every Office user
AI Powered
When Microsoft Fabric is not yet activated in your tenant, you can activate it in the Admin Portal. Please note that Microsoft Fabric Capacity(Trial) or Power BI Premium Capacity is required to get started with Microsoft Fabric.
Microsoft Build
Now that we have seen the initial sessions during Microsoft Build, it's time to delve deeper into a topic. But what an announcement! We have all worked hard on this in the last couple of months. We have done a lot of testing and provided a lot of feedback. And personally, I can say that all feedback has been listened to carefully.
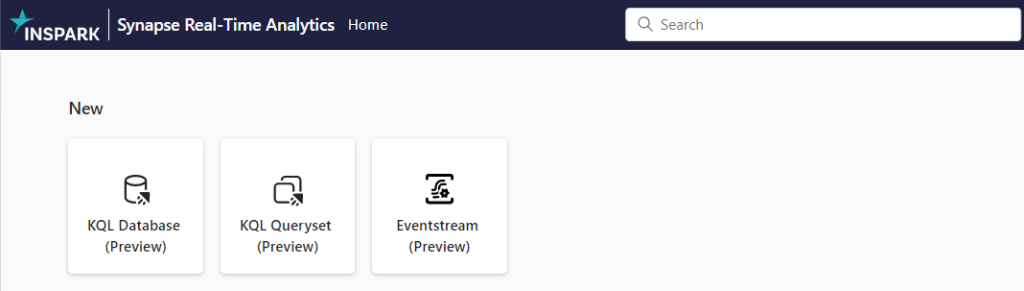
In this blog, I will delve deeper into Real-Time Analytics, one of the available experience in Microsoft Fabric. An experience is a look and feel of various Fabric Artifacts for a specific role such as a Data Engineer, Data Analyst or Data Scientist. For all available experiences see picture above.
Real-Time Analytics
Real-Time Analytics is critical in today's fast-paced business environment. It enables organizations to react immediately to events and trends as they happen, rather than reacting to historical data afterwards. The Real-Time Analytics workload allows users to monitor, analyze, and visualize data in real-time to make fast and data-driven decisions.
Here are some key features and functionalities of Real-Time Analytics in Microsoft Fabric:
Real-time data processing: The workload supports processing large amounts of data in real-time, giving users instant access to up-to-date information.
Advanced analytics: Built-in analytics capabilities enable users to apply complex calculations and statistical models to real-time data for deep insights.
Flexible visualizations: The app offers a wide range of visualization options, such as graphs, charts, and dashboards, to present data in a clear and understandable manner.
With Data Activator(coming soon): Users can set up custom notifications and alerts based on predefined criteria, keeping them informed of important events or anomalies in real-time.
As you can see, you can use Real-Time Analytics for a range of solutions, such as IoT analytics, Telemetry data, human and system logs and in many scenarios including manufacturing operations, cybersecurity, oil and gas, automotive and many more.
Benefits
One of the great benefits of using Real -ime Analytics in Microsoft Fabric is that you have a seamless integration with other artifacts in Fabric such as Lakehouse, Data Warehouse and Machine Learning Models for Predictive Analytics. One of the other benefits in Microsoft Fabric is that you don’t have to start from scratch, is very easy to connect to existing Event Hubs to load your streaming events into Fabric. Which I will explain in my next blog.
Real-Time Analytics Artifacts
Currently the Real-Time Analytics workload supports 3 different artifacts:
KQL Database: A Kusto database exactly the same as you were used to in Azure Data Explorer
KQL Queryset: Collection of queries which you can run on top of your KQL Database
Eventstream: Capture, transform and route real-time event stream to various destinations with a no-code experience. Similar to Azure Stream Analytics
OneLake: The foundation for Microsoft Fabric
OneLake eliminates today’s pervasive and chaotic data silos by providing a data lake as a service without you needing to build it yourself. OneLake is the OneDrive for data and like OneDrive, OneLake is provisioned automatically with every Fabric tenant with no infrastructure to manage. All Fabric Artifacts, such as mentioned above for Real-Time Analytics are deployed/ provisioned automatically into the Onelake upon on creation. How easy is that?
Having a closer look at the picture above, you see an end to end workflow for a Real-Time Analytics scenario.
Ingest the data from Event Hub, custom apps, structured and Unstructured data source with pipelines and Dataflows.
Store the data in a KQL Database or Lakehouse.
Expose the data in Power BI and/or make available in Notebooks and KQL Queriesets.
Train and test the data with Machine Learning Models and Experiments.
With this end to end workflow you can directly see which artifacts you need to use to build your Real-Time Analytics Solution.
Public Preview
It's important to note that as Microsoft Fabric is currently in Public Preview, additional functionality is still being developed, and feedback is being incorporated. This presents a great opportunity for users to get involved early, provide feedback, and contribute to the further development of Microsoft Fabric.
When you decide to start using Microsoft Fabric and encounter any issues with the Real-Time Analytics workload, please don't hesitate to reach out to me. I’m here to assist and appreciate your feedback to further enhance the platform.
Click below to read more about Microsoft Fabric and Real-Time Analytics.
In my next blog I will get a bit deeper how easily you can connect existing Event Hubs to Microsoft Fabric. So stay tuned(published on may 26th 2023)
Note:
Please be aware that Microsoft Fabric is currently not authorized for production use as it is still in the Public Preview phase. It's important to consider this when planning deployments or making critical business decisions.
In the video below, Tzvia Gitlin Troyna, a Principal Manager with Synapse Real-Time Analytics experience in Microsoft Fabric, shares a first look at what's included in the first release of Real-Time Analytics in Microsoft Fabric.
Microsoft Purview Pricing and introduction of Purview Applications
The Microsoft Purview pricing page has been updated. Below I have listed most of the changes. The most important changes are the introduction of the Microsoft Purview Applications and the pricing of the Insights Generation. The standard level of 1 capacity unit of 2 GB metadata storage and 25 operations per sec has been increased to 10 GB.
Post has been updated on April 25th.
Microsoft Purview Data Map
The Microsoft Purview Data Map stores metadata, annotations and relationships associated with data assets in a searchable knowledge graph.
Data Map is billed across three types of activities:
Data Map Population– examples include metadata & lineage extraction or classification based on metadata & content inspection.
Data Map Enrichment– examples include use of resource sets to optimize storage of data lake assets, or aggregation of classifications to generate insights
Data Map Consumption- examples include serving up search results or rendering lineage graph. This also includes the use of Apache Atlas API to build apps on Data Map.
Data Map Population
Automated Scanning, Ingestion & Classification
Data Map population is serverless and billed based on the duration of scans (includes metadata extraction and classification) and ingestion jobs. Automated scans using native connectors trigger both scan and ingestion jobs. Push based updates from a Microsoft Purview client (e.g., lineage push from Azure Data Factory or Azure Synapse Analytics) only trigger ingestion jobs.
Price
For Power BI online
Free for a limited time
For SQL Server on-prem
Free for a limited time
For other data sources
€0.582 per 1 vCore Hour
Data Map Enrichment
Advanced Resource Set
Advanced Resource Set is a built-in feature of the Data Map used to optimize the storage and search of data assets associated with partitioned files in data lakes. Billing for processing the resource set data assets is serverless and based on the duration of the processing, which can vary based on the change in partitioned files and resource set profile configured. In the Management Center you have an option to toggle on or off.
Note: By default, the advanced resource set processing is run every 12 hours for all the systems configured for scanning with resource set toggle enabled.
Price
Advanced Resource Set
€0.194 per 1 vCore Hour
Insights Generation
Insights Generation aggregates metadata and classifications in the raw Data map into enriched, executive-ready reports that can be visualized in the Data Estate Insights application and granular asset level information in business-friendly format that can be exported. Report visualization and export incurs charges from Insights Report Consumption in the Data Estate Insights application.
Price
Report Generation
€0.758 per 1 vCore Hour
Insight Generation is new for me, currently it looks like around €70,00.
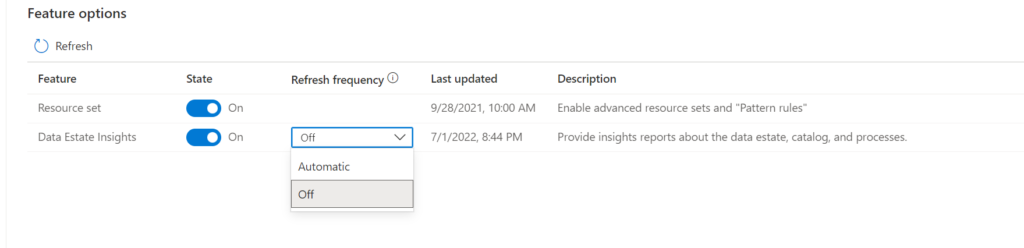
Note: By default, Insights Generation is enabled and provisioning and can be turned off in the Management center of Microsoft Purview governance portal. In the Management Center you have now an option to toggle on or off the Insight Generation. If the toggle is on and the report frequency is off than you can still see the reports with the latest report generation. If set to automatic your reports will refreshed based on your scanning and activities in de Portal. Currently the automatic refresh is weekly.
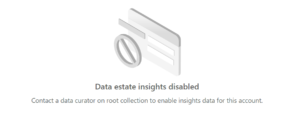
If the toggle is off the Insight Generation activity will you give you the following warning:
Data Map Consumption
Elastic Data Map
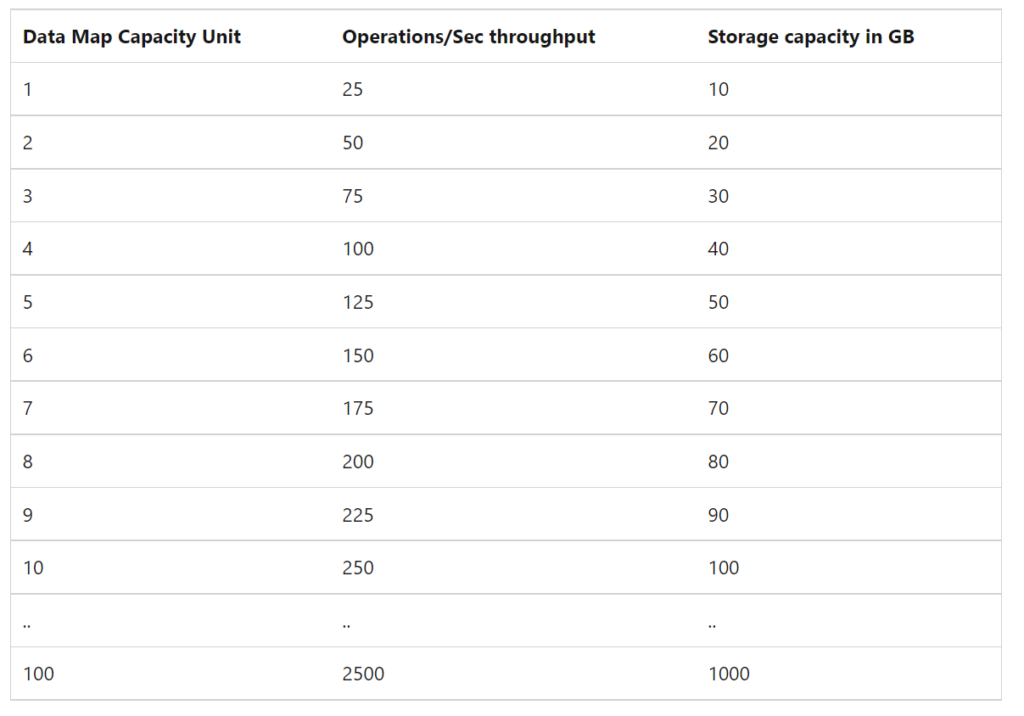
By default, a Microsoft Purview account is provisioned with a Data Map of at least 1 Capacity Unit. 1 Capacity Unit supports requests of up to 25 data map operations per second and includes storage of up to 10 GB of metadata about data assets.
Price
Capacity Unit
€0.380 per 1 vCore Hour
Note: The storage size was until last week 2 GB for 1 capacity Unit and has been resized to 10 GB. so that is a major change.
Microsoft Purview Applications
Microsoft Purview Applications are replacing the C0, C1 and D0 options which we had previously. Microsoft Purview Applications are a set of independently adoptable, but highly integrated user experiences built on the Data Map including Data Catalog, Data Estate Insights and more. These applications are used by data consumers, producers, data stewards and officers that enable enterprises to ensure that data is easily discoverable, understood, high quality, and all use is per corporate and regulatory requirements.
Data Catalog
Data Catalog is an application built on Data Map for use by business users, data engineers and stewards to discover data, identify lineage relationships and assign business context quickly and easily.
Price
Search and browse of data assets
Included with the Data Map
Business Glossaries
Included with the Data Map
Lineage Visualization
Included with the Data Map
Self-Service Data Access
Free in preview
Data Estate Insights
Price
Insights Consumption
€0.194 per API call
Note: Insights consumption is billed per API call. One API call returns up to 10,000 rows of tabular result. Like Insight Generation I've no idea yet what this will do with the cost. As soon this is available I will update this article.
Data Access Policies for SQL and Data Lakes(preview)
Data owners can centrally manage thousands of SQL Servers and data lakes to enable quick and easy access to data assets mapped in the Data Map for performance monitors, auditors, and data users.
Price
SQL DevOps access
Free in preview
Data Lake data asset access
Free in preview
Workflows(Preview)
Data owners and stewards can automate commonly used repetitive tasks associated with business processes like glossary curation and approval tracking using workflow management.
Price
Business Workflows
Free in preview
Data Sharing(Preview)
In-place Data Sharing lets users share data easily from within Microsoft Purview governance portal both within and between organizations, providing near real-time access to data without duplication.
Price
In place sharing for Azure Blob Storage and Azure Data Lake Storage (ADLS Gen2) storage accounts
Free
More details on data sharing in Microsoft Purview can be found here.
Pricing Example
Based on the example which is published on the pricing page, I've done a Calculation:
Example Scenario:
Data Map can scale capacity elastically based on the request load. Request load is measured in terms of data map operations per second. As a cost control measure, a Data Map is configured by default to elastically scale up to a peak of 8 times the steady state capacity.
For dev/trial usage:
Data Map (Always on): average of 2 capacity unit x Price per capacity unit per hour x 730 hours per month
Scanning (Pay as you go): Total duration (in minutes) of all scans in a month / 60 min per hour x 32 vCore per scan x €0.582 per vCore per hour
Resource Set: Total duration (in hours) of processing resource set data assets in a month * Price per vCore per hour
The total cost per month for Azure Purview = cost of Data Map + cost of Scanning + cost of Resource Set
Assuming above Scenario that we only use 1 Capacity Unit and use not more then 10 GB of Metadata storage and we scan our data once a week for 2 hours.
Data Map 2 CU x €0.380 X 730 hours = €554
Scanning 4 scans x 4 hours x 32 VCore x €0.582 per vCore per hour = €297
Resource Set 30 days x every 12 hrs x 8 Vcore x €0.194 per vCore per hour €93
In Total €944 including 4 scans, Data Estate Insight excluded. If you leave Microsoft Purview as is and no scanning you base fee will be €277 for 1 CU and Resource Set toggle need to be switch off
Data Estate Insights every week(4) x 8 Vcore x 4 hours x €0.758 = €97
Like always, in case you have questions, leave them in the comments or send me a message.